Description
James Cameron made a movie in 3D, so it's only fair that Cameron Hall gets the same treatment - we're a little more deserving than a Pocohontas parable. Having a 3d representation of the clubs would be good to have for a variety of purposes, including but not limited to..
- A historical document for the Cameron Hall clubs in a tangible, graphical form
- An opportunity to mess with modern computer vision algorithms
- Vanity shots can be taken as those expensive DSLR cameras a number of UCCans own are shown off in a similarly vain manner
- Bragging rights - doing new things to keep us ahead of other historic clubs with electronic coke machines
- .. and if you're into that sort if thing, playing various PC games on a map of Cameron Hall - "Bomb has been planted!" as you flashbang unigames or "SPY AS UNISFAN" as a dispenser goes down
Techniques
The use of PhotoTour Bundler, CMVS and PMVS2 is (in that order) a workflow that can produce a dense point cloud. Compared to just a year ago, when Bundler and Photosynth produced camera positions and a sparse, low quality point cloud, this workflow can produce impressive results. CMVS splits photos into batches of a manageable size, PMVS then reconstructs those batches and the union of them is the end product.
MapTek, a Perth-based mining company, developed iSite, a LASER-based 3D scene detection technology. One model takes 70 megapixel panorama images along with the laser points, though is made for large scale surveys. Perhaps we could borrow something from their range.
Schedule
After the initial test (seen below) of the Bundler->CMVS->PMVS2 workflow, numerous photos will be taken strategically to improve room coverage, supplanting the test set. Future happenings are TBA, but soon to be eventuated.
Initial results
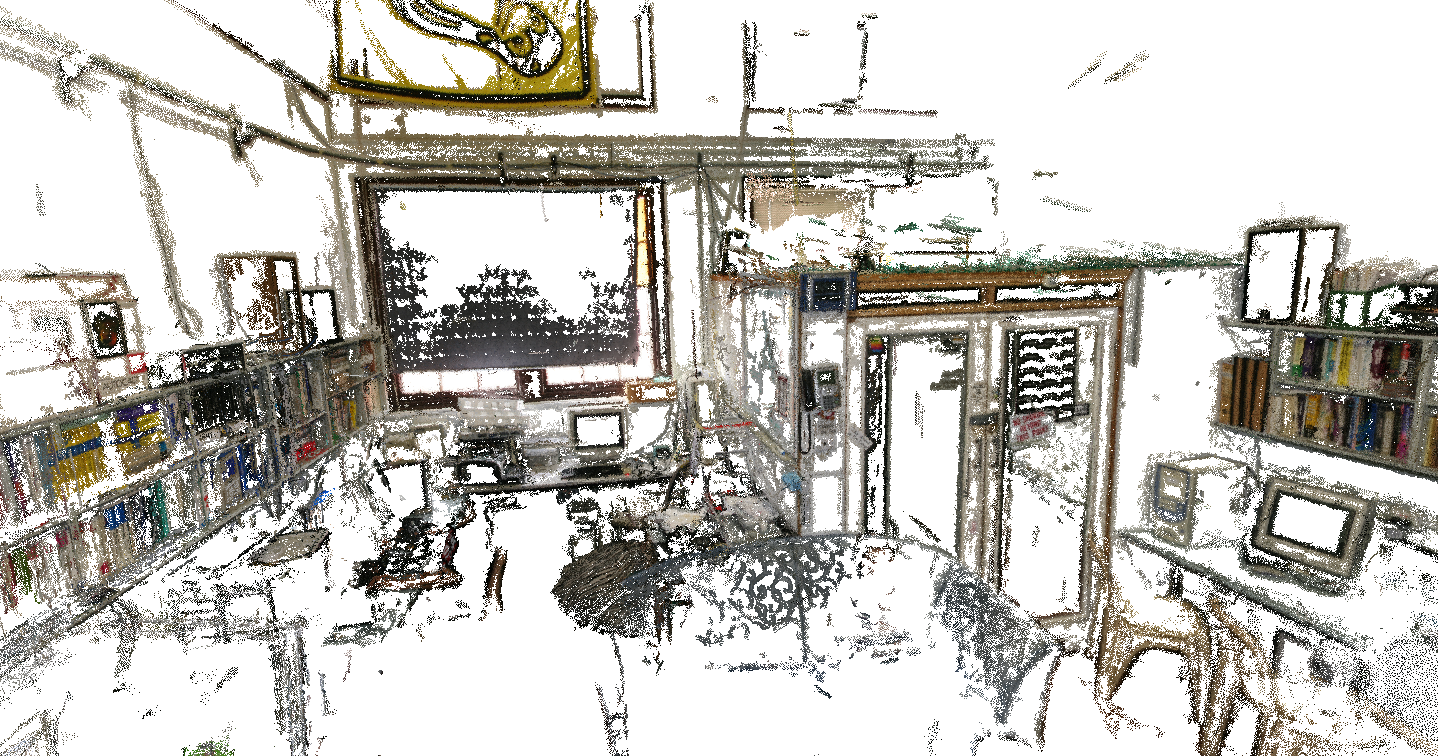
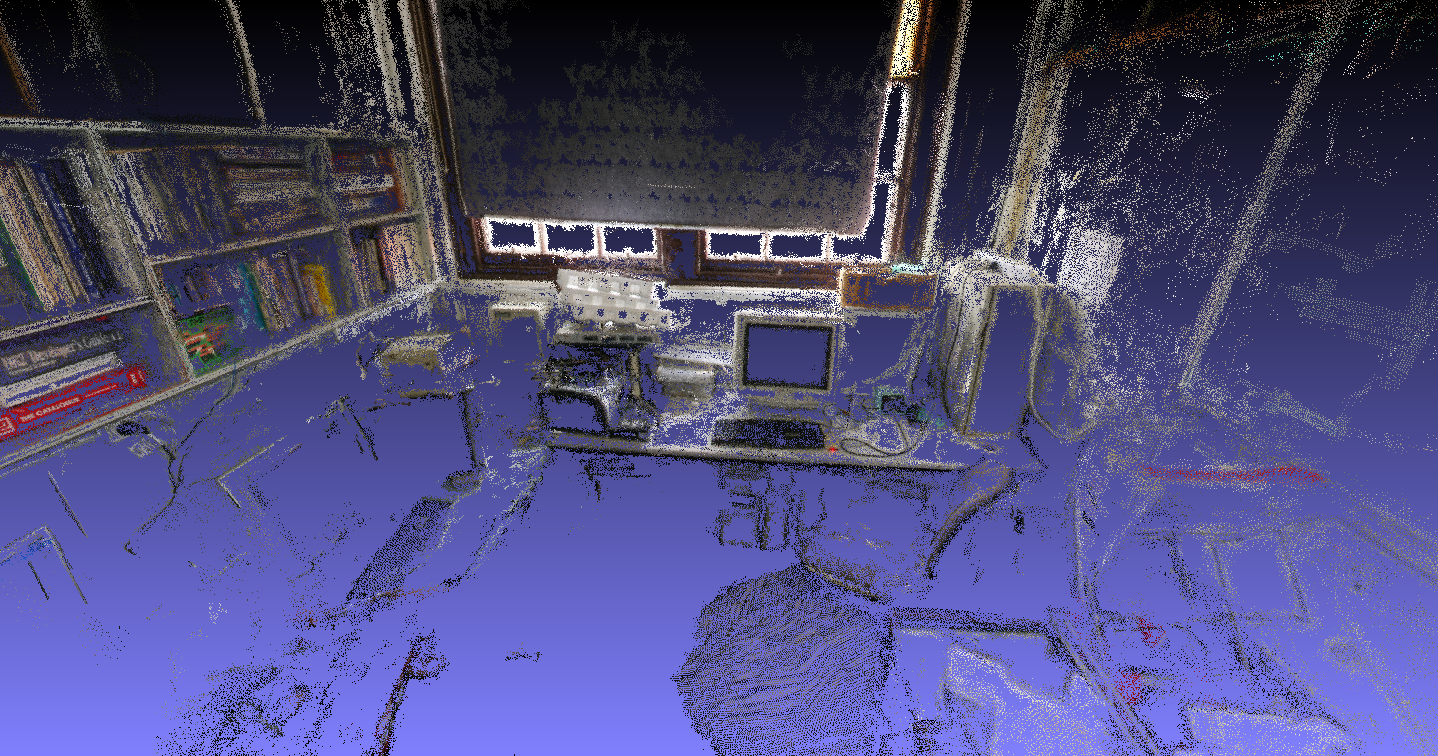
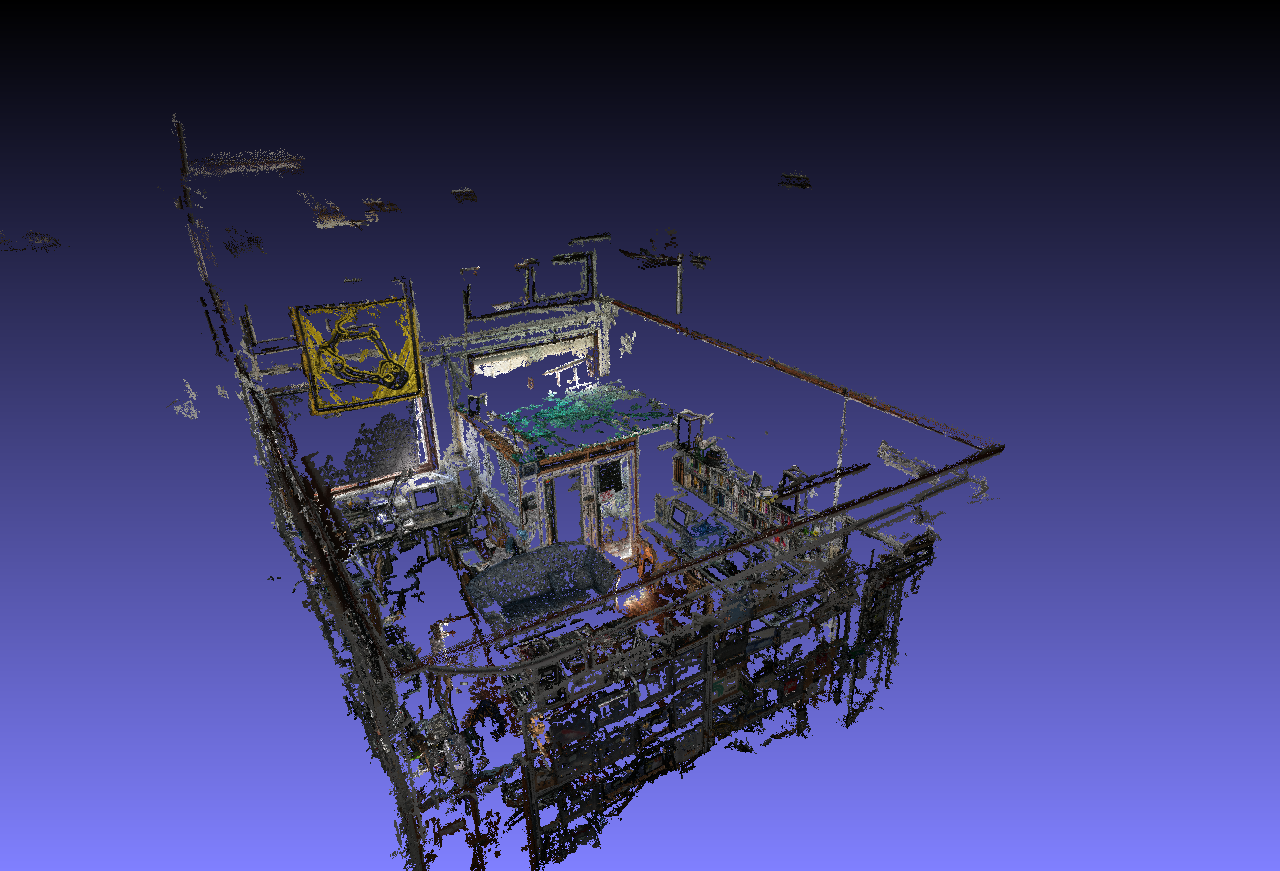
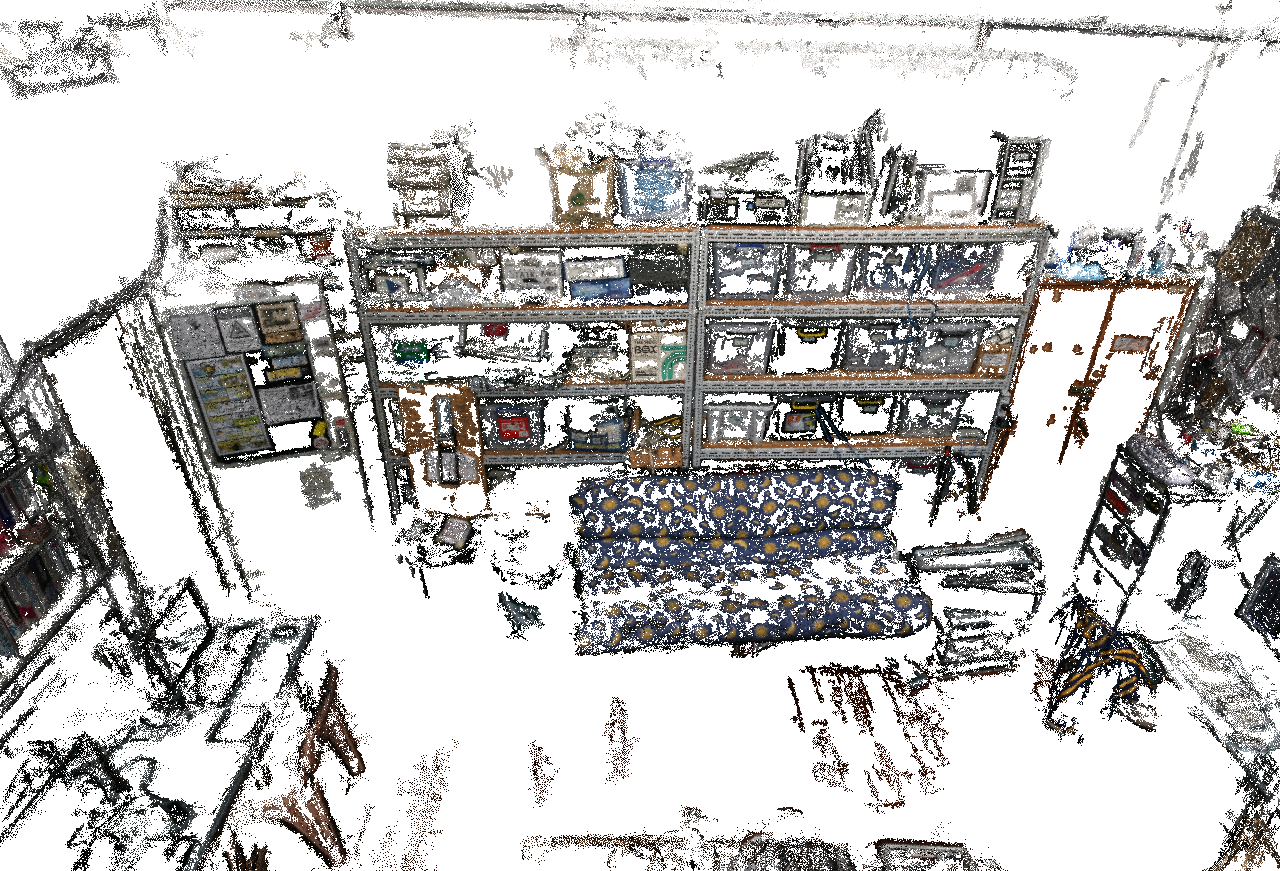
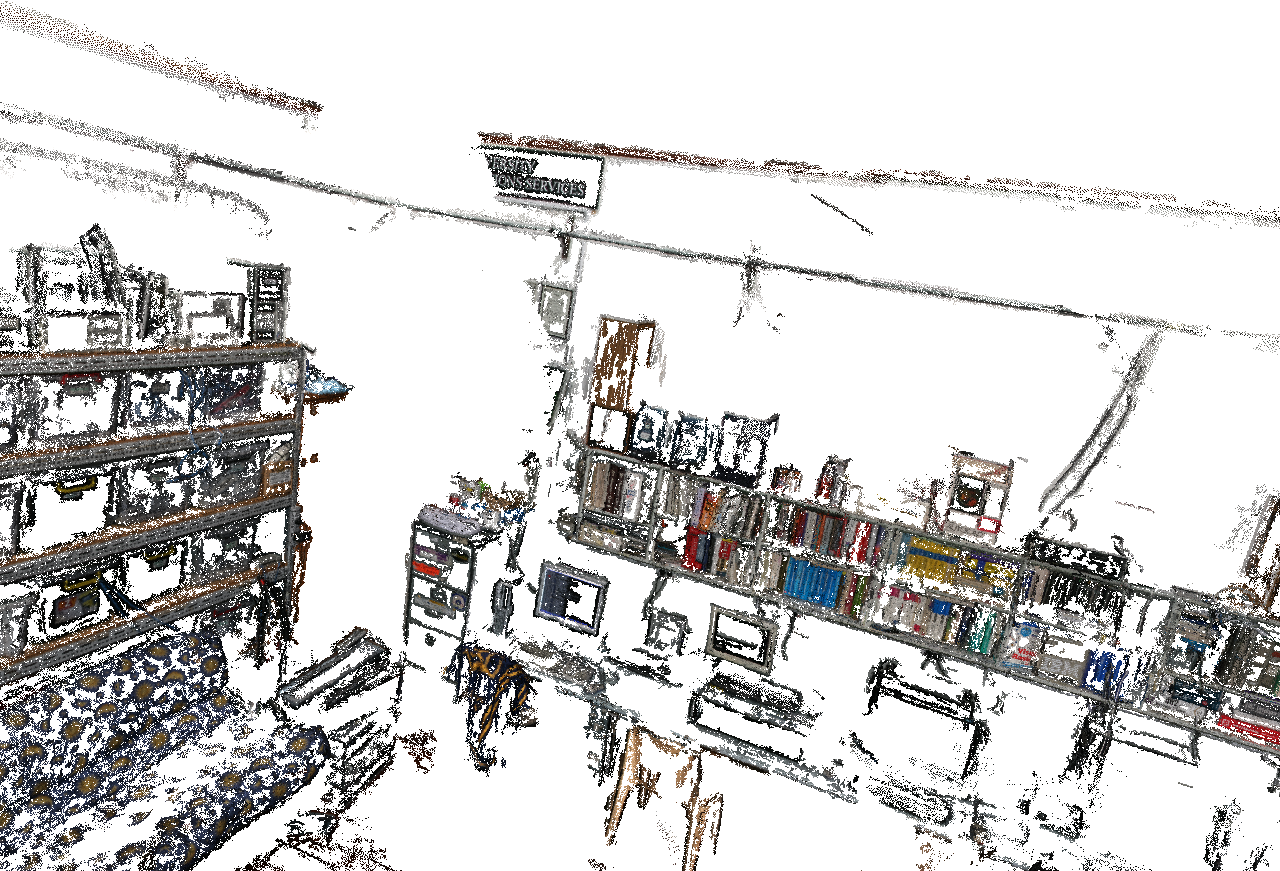
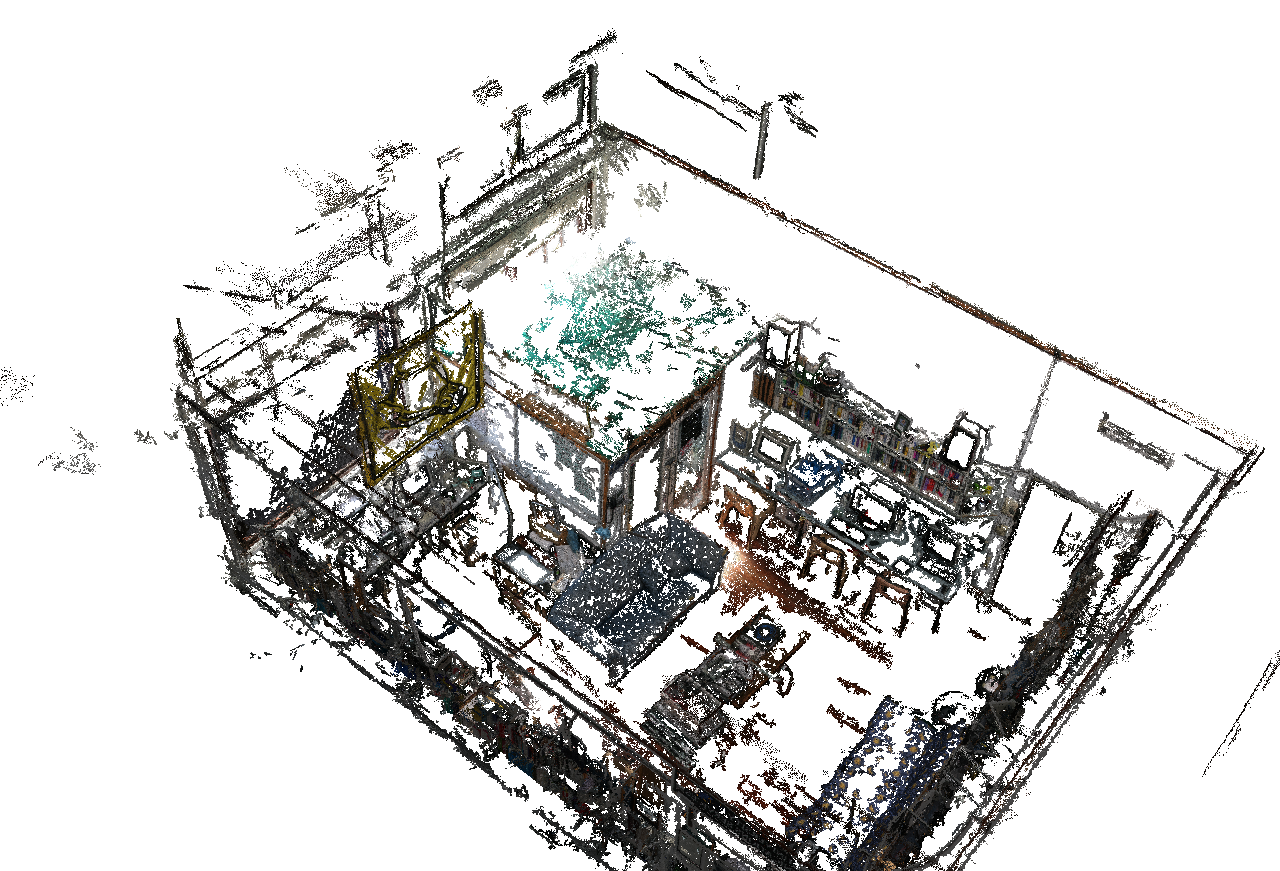
The input set was taken quickly and lacks detail and coverage of the clubroom. If seen as a stress test of the workflow, since CMVS generated fine-grained segments of the room with a maximum of 12 (at times, fewer) images to be reconstructed, the result is impressive. The groupings can be larger and with some selective photography, of better coverage and even higher detail.
A large .ply file of the generated pointcloud can be downloaded here. Beware, it's 130MB. Meshlab or Scanalyze are suitable for viewing it.
For those with less adventurous bandwidths, here is a small selection of images. Bear in mind, rotating around the dataset is more fun ![]()
|
|
|
|
|
|
The people
[TPG] tpg, John Hodge
[CJS] spartan, Chris Squire
- The poor souls who have to figure out the archaic data format many years from now, if it's timecapsuled
- .. and hopefully you. Do make contact if you have a curious interest in goings-on or if you'd like to take part in the process.
Stay tuned for updates!
